TaskTrace lets you choose a single task and view either its critical predecessor
& successor path(s), or its full logic path(s) of critical path and
non-critical tasks. This gives you two ways to cut through large files and
see just what is pushing key tasks or events and also what they affects.
Step 1 -
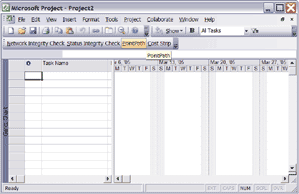
Click TaskTrace
With the file open, first select a detail task, then click TaskTrace
on the SDSI U Analysis Tools toolbar as shown (you may also select
it from the SDSI Analysis Tools menu under the Tools drop-down menu).
If you select a task that cannot be analyzed, you will see a dialog
box indicating why and the tool will shut down, taking no action. |
 |
Step 2a -
“Drivers” Only Logic Option
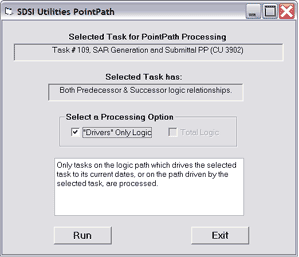
After launching TaskTrace on an appropriate task, you will see a
dialog box, indicating what task was selected for processing and the
logic type(s) associated with it. You also must now select a processing
option. The “Drivers” Only Logic option shows only those
tasks which either drive the selected task to its current date or
are driven by the selected task (and subsequent linked tasks) to their
current dates . . . |
 |
Step 2b -
Total Logic Option
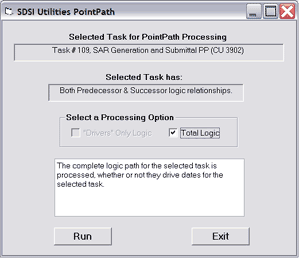
The Total Logic option shows all tasks on all the logic paths which
connect to the selected tasks, whether or not they drive the selected
task’s start or finish date. This option usually takes somewhat
longer to process. After selecting a processing option, click “Run”
to start processing. Clicking “Exit” will close the tool
without any processing taking place.those tasks which either drive
the selected task to its current date or are driven by the selected
task (and subsequent linked tasks) to their current dates. |
 |
Step 3 -
Click “OK”
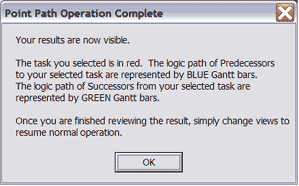
When processing is complete, this informational dialog box appears.
After reading it, simply click “OK”. |
 |
Step 4 -
Viewing Your Results
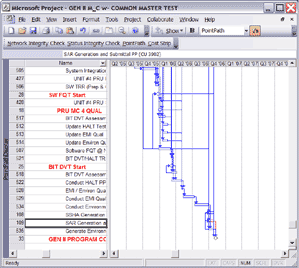
TaskTrace creates a special view in Microsoft Project for viewing
your results. In that view your selected task is highlighted and all
tasks in the view are arranged chronologically.
Next: CostFree |
 |


